10-Year Treasury hits 4.59%, highest since Feb. 2025
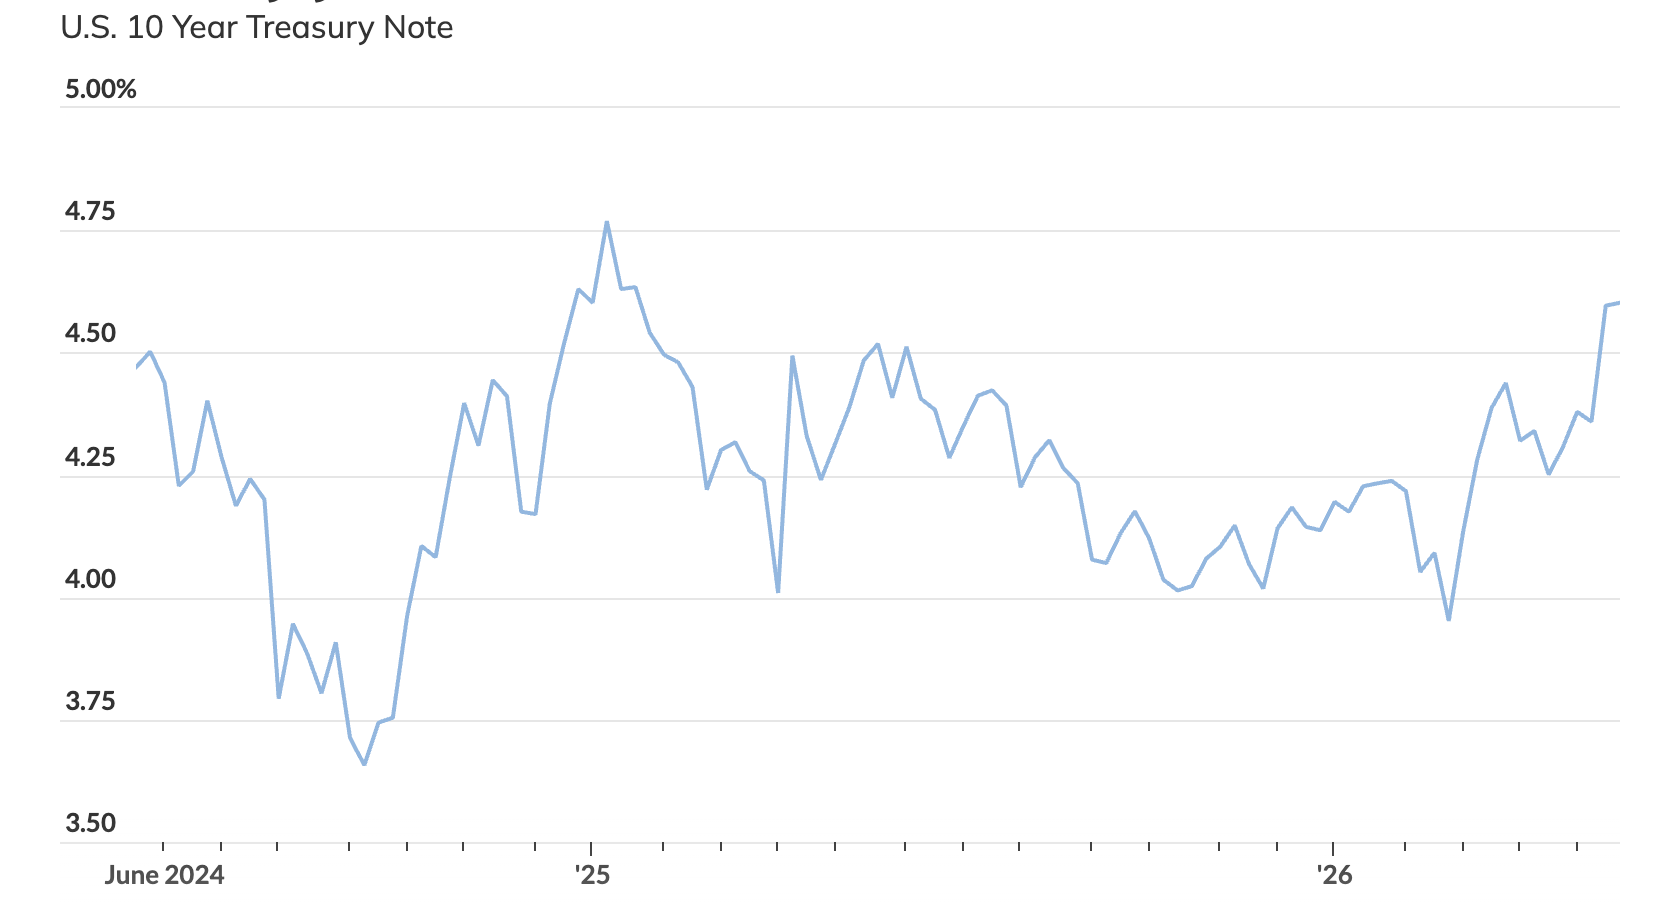
10-year Treasury yield rose to 4.59% on May 15, 2026, its highest since Feb. 2025; the 2-year yield was 4.09%, drawing attention to the 10-2 spread and yield-curve shifts.
On May 15, 2026, U.S. Treasury trading pushed the 10-year yield to 4.59% and the 2-year yield to 4.09%. Each rate reached its highest level since February 2025.
The gap between short- and long-term yields, known as the yield curve, is closely watched because past inversions have often preceded recessions. An inverted curve occurs when long-term yields are lower than short-term yields. The 10-year minus 2-year spread was negative continuously from July 5, 2022, through August 26, 2024; its most recent negative reading was September 5, 2024. Historically, the time from a negative 10-2 spread to the start of a recession has ranged from about 18 to 92 weeks. Measured from the first date a spread turns negative, the average lead time to recession is about 48 weeks. Measured from the last positive spread date before a downturn, the average lead time is about 18.5 weeks.
The 10-year minus 3-month spread showed a similar pattern. That spread was negative from October 25, 2022, to December 12, 2024. Since February 26, 2026, the 10-3-month spread has swung between positive and negative readings. From the initial negative reading, the average lead time to recession for the 10-3-month spread is about 48 weeks; from the final positive reading after a negative period, the average lead time is about 13 weeks. The observed range of lead times for the 10-3-month spread runs roughly 34 to 69 weeks.
Federal Reserve policy influences short-term yields. The Federal Reserve began cutting the federal funds rate in September 2024. Movements in the federal funds rate affect bank lending costs and can feed into mortgage rates over time. Freddie Mac’s most recent weekly survey showed the average 30-year fixed mortgage rate at 6.36%.
Long-term charts of the 10-year Treasury extend back to 1965 and include episodes such as the 1973 oil embargo and the higher inflation period that followed. Market participants monitor weekly Treasury yields and related ETFs, including Vanguard 0-3 Month Treasury Bill ETF (VBIL), Vanguard Intermediate-Term Treasury ETF (VGIT) and Vanguard Long-Term Treasury ETF (VGLT), to track expectations for growth, inflation and Fed policy.
Traders and investors are watching changes in yields and spreads for information on economic conditions and interest-rate expectations as trading continues.
Articles by this author