What is yield in finance?
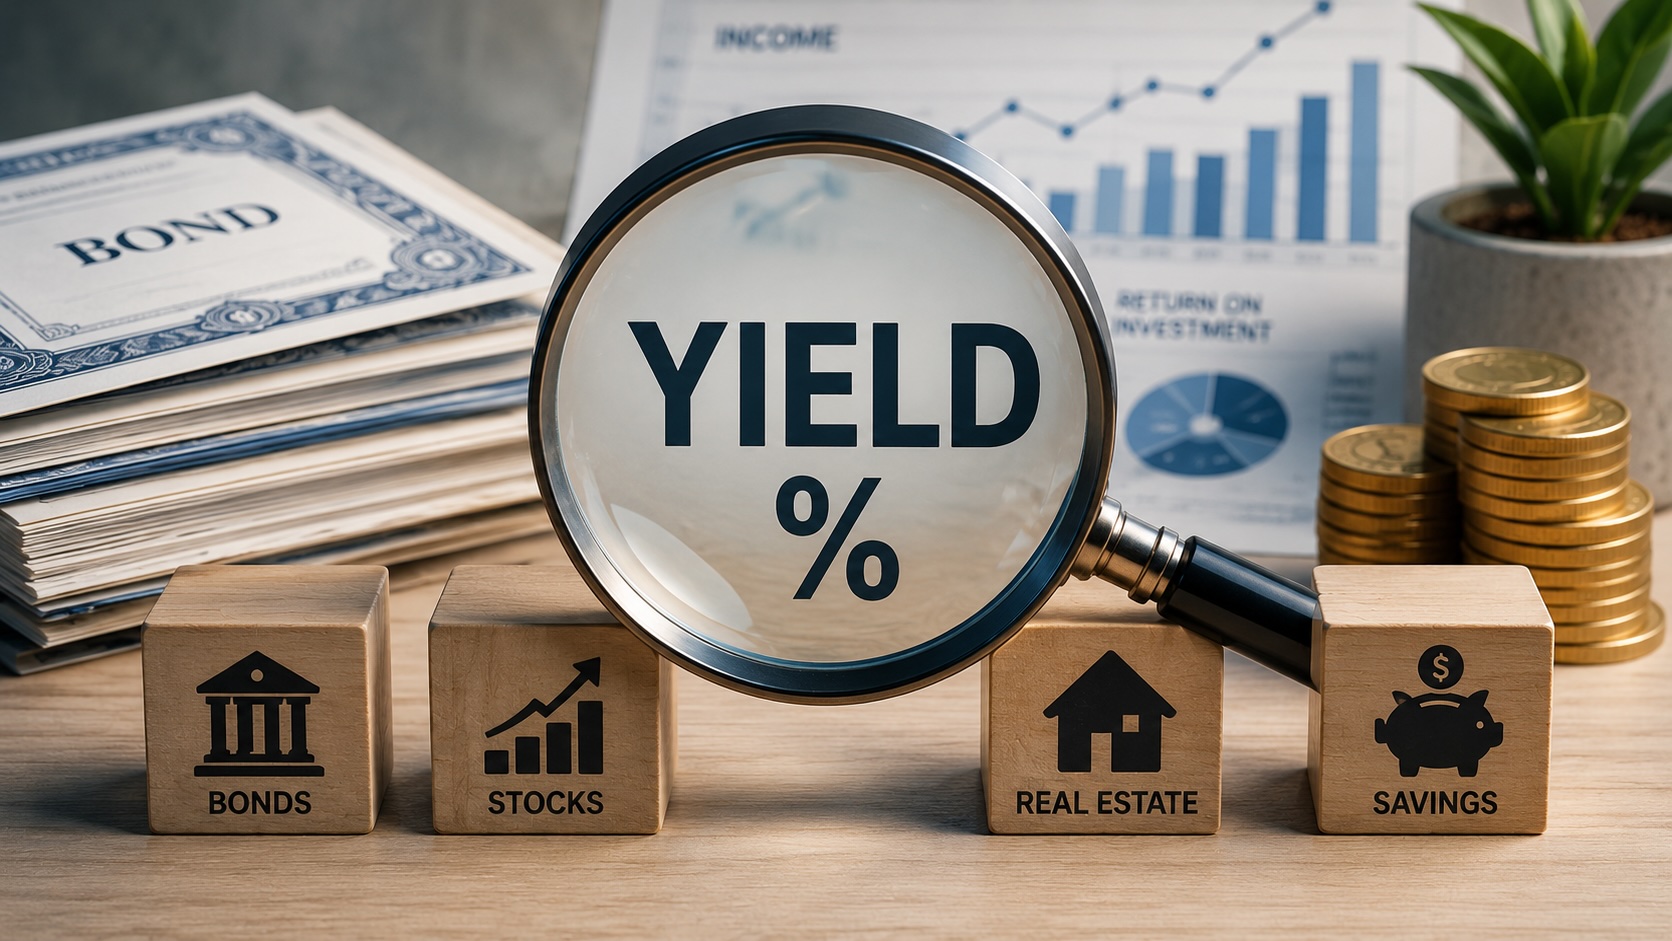
Yield is a common investing term, but it often gets confused with return. Here’s what it actually means, how it’s calculated, and how it differs from return.
On this page
What is yield in finance?
Yield measures the income an investment generates relative to its price or value. Investors use it to compare how much cash flow different assets produce, whether that is bond interest, stock dividends, or deposit interest.
If you hold a bond that pays $50 per year and you paid $1,000 for it, your yield is 5%. If a stock pays $2 in dividends and trades at $40, the dividend yield is 5%. The underlying asset changes, but the calculation works the same way: yield shows how much income you get relative to the amount invested.
Yield gives investors a way to compare income across very different assets. A corporate bond, a dividend stock, and a savings account can all be evaluated by the same question: how much income do they generate relative to what you put in?
When bond yields rise, it usually reflects either higher interest rates or higher perceived risk. When a stock’s dividend yield rises sharply, the company may be paying out more, or the share price may have dropped. A high yield is not always a good sign – sometimes it reflects falling prices or rising risk.
How yield is calculated
Yield follows a simple formula:
Yield = Annual Income / Price × 100
“Annual income” means the cash the investment pays over a year: bond coupons, stock dividends, or deposit interest. “Price” can mean either your original purchase price or the current market price, depending on the type of yield you are measuring.

Cost yield uses the original purchase price. Current yield uses today’s market price. If you bought a bond at $900 and it pays $45 annually, your cost yield is 5%. If that same bond now trades at $1,000, its current yield drops to 4.5%.
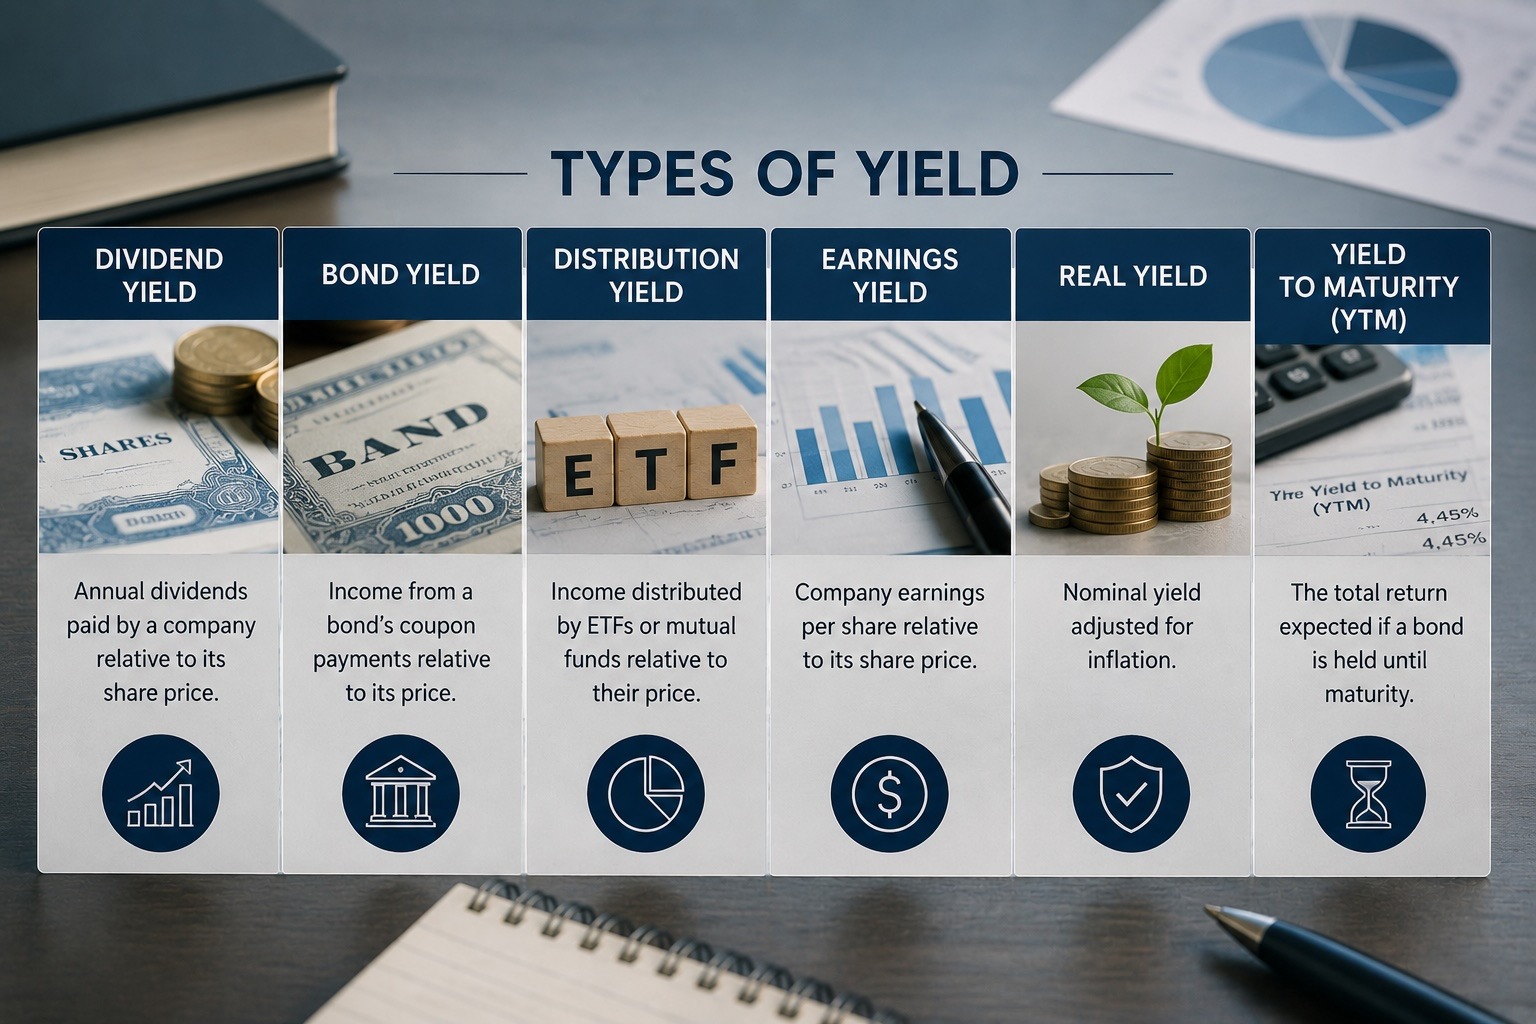
For bonds, there’s a third version called yield to maturity, or YTM. It factors in the coupon payments you’ll receive, any difference between the purchase price and the face value returned at maturity, and the time remaining on the bond. YTM is generally the most complete basis for comparing bonds, because it reflects what you’ll actually earn if you hold to the end.
For stocks, the calculation is more direct. Take the annual dividend per share, divide by the current share price, and multiply by 100. A stock paying $3 in annual dividends and trading at $60 has a dividend yield of 5%.
Main types of yield explained
Dividend yield applies to stocks and measures how much a company pays in dividends relative to its share price. Companies with long dividend histories in sectors like utilities, consumer staples, and financials tend to attract income-focused investors partly on this basis.
Bond yield comes in several forms. Current yield gives a quick snapshot of income relative to price. Yield to maturity is the more complete measure, accounting for the bond’s full remaining life. Yield to call matters specifically for bonds that the issuer can redeem before the maturity date.
Distribution yield applies to ETFs and mutual funds that distribute income to shareholders regularly. Because it’s based on recent distributions rather than a fixed payment schedule, it tends to fluctuate more than bond or stock yields.
Earnings yield is the inverse of the price-to-earnings ratio: earnings per share divided by share price. Investors often use earnings yield to compare stocks with bonds on a similar percentage basis. If a stock has an earnings yield of 6% and a government bond yields 4%, the comparison can shape how that stock is valued relative to fixed-income alternatives.
Real yield adjusts nominal yield for inflation. A bond yielding 5% during a period of 3% inflation has a real yield of roughly 2%. When inflation runs high, the gap between nominal and real yield becomes large enough to change how investors rank their options.
Yield vs return: what’s the difference?
Yield and return are related, but they are not the same thing.
Yield covers only the income component: dividends, coupons, interest payments received while holding an asset. It’s expressed as a percentage and says nothing about what happens to the price of the asset itself.
Total return captures both. If you buy a stock at $100, receive $4 in dividends, and sell at $110, your total return is 14%. Yield alone would show 4%.

A high yield can coexist with a weak total return. A stock yielding 7% in dividends looks attractive on that measure alone, but if the share price falls 15% over the same period, the net result is a loss. A growth stock, by contrast, may pay no dividend and a yield of zero can deliver a strong total return entirely through price appreciation – something yield figures won’t capture at all.
Income-focused investors, including retirees and funds with regular distribution requirements, naturally weight yield more heavily in their analysis. Growth-oriented investors tend to focus on total return. Most investors look at both. Yield shows what an asset pays along the way; total return shows what the investment actually delivered.
Articles by this author