U.S. new-home sales fall 6.2% in April; median price up 8%
New single-family sales fell 6.2% to a 622,000 seasonally adjusted annual rate in April; median price rose 8% month-over-month to $422,500.
The Census Bureau reported U.S. new single-family home sales fell 6.2% in April to a seasonally adjusted annual rate of 622,000.
April’s pace was down from March’s 663,000 and 11.3% below April a year earlier. The reading missed the consensus forecast of 661,000. Sales figures are volatile month to month, and analysts often use a six-month moving average to assess the underlying trend.
The median sales price for a new single-family home rose 8.0% from March to $422,500, the largest monthly increase in seven years. The median was 6.2% lower than April a year earlier. Adjusted for inflation using the CPI-U, the real median price increased 7.1% month-over-month and fell 1.6% year-over-year.
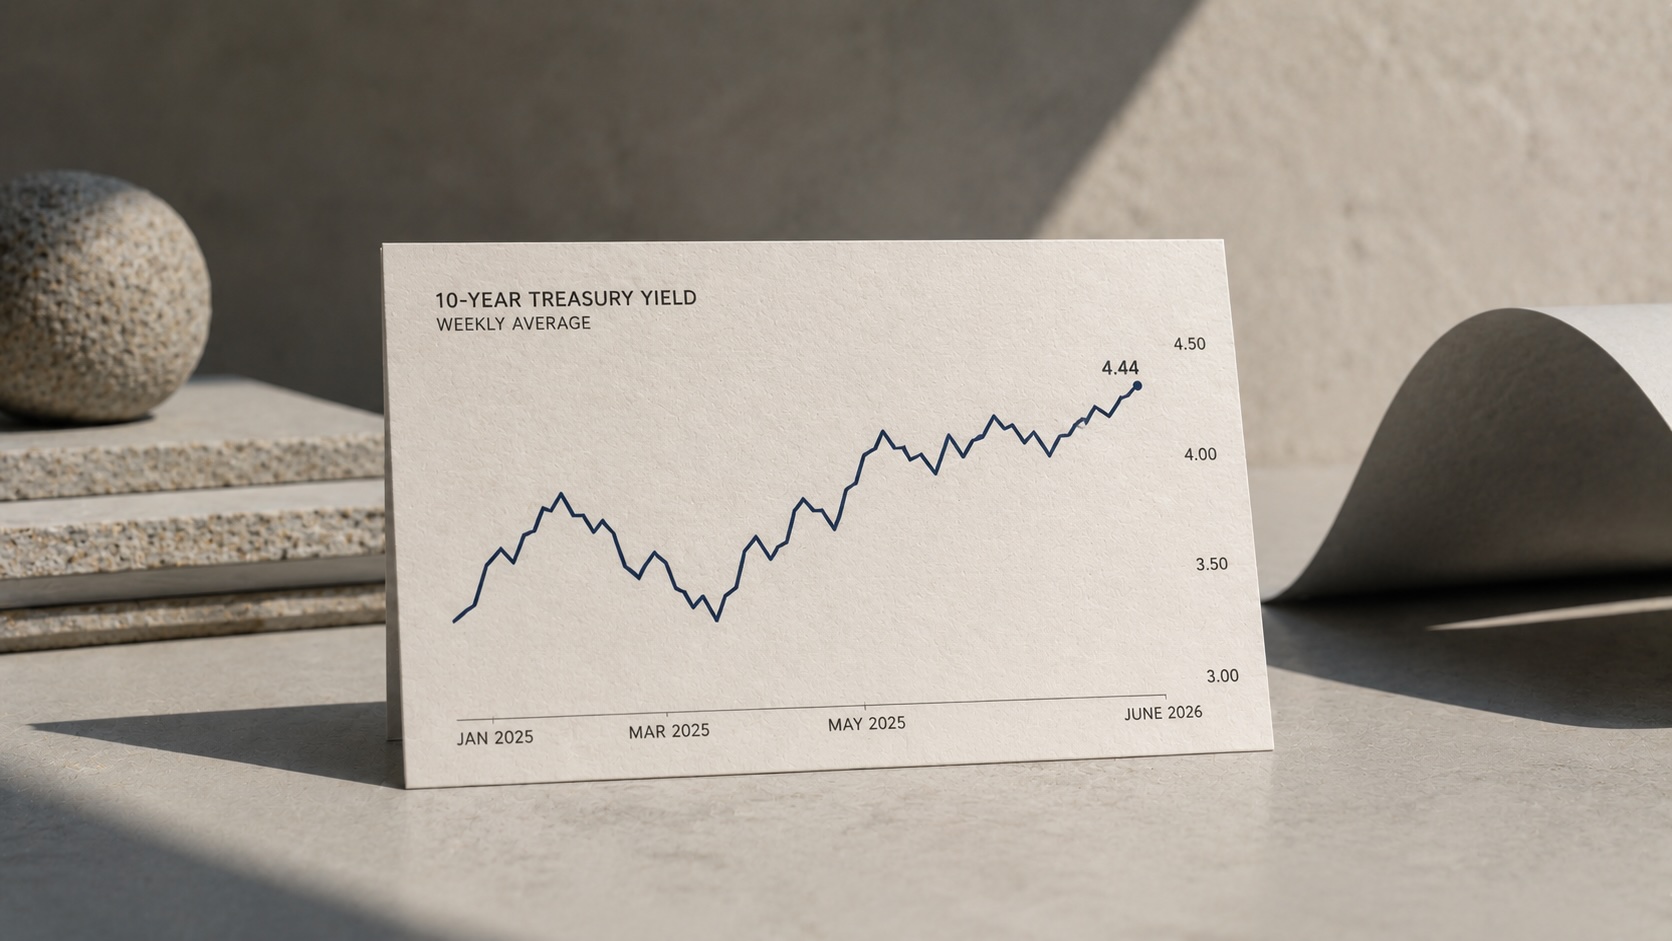
Freddie Mac reported the average 30-year fixed mortgage rate was 6.33% in April 2026. At that rate, many homeowners with lower existing mortgage rates are likely to keep their loans rather than sell, which reduces available for-sale inventory.
The new-home sales series begins in 1963. Sales rose through the early 2000s and peaked during the housing bubble, with the population-adjusted share reaching 0.47% in July 2005. The series hit a low of 0.09% in February 2011. Sales increased after 2011 and peaked near the end of 2020, retraced for about two years, showed steady growth at the start of 2023 and have been largely flat over the past couple of years.
Using Census Bureau mid-month population estimates, the U.S. population has grown 82.2% since 1963. Raw new single-family sales are 5.2% higher than in 1963, while the population-adjusted sales rate is 42.2% lower.
April’s data combine a monthly decline in sales with a sizable single-month gain in nominal prices.
Articles by this author