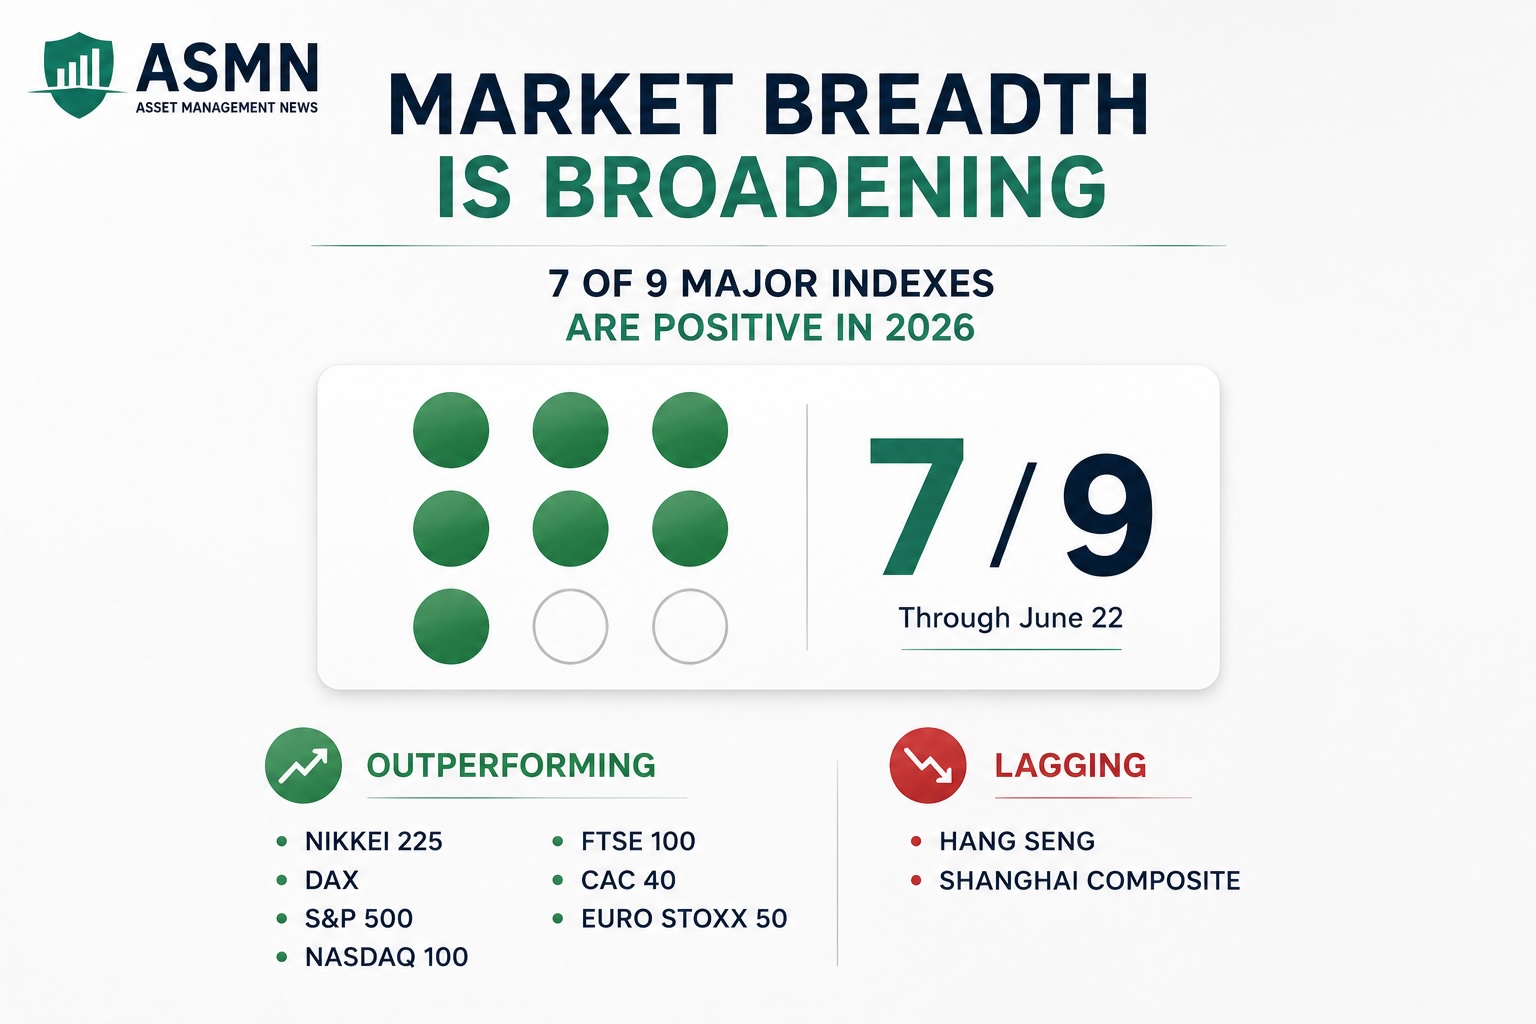
Global markets: 7 of 9 indexes up through June 22

Through June 22, 2026, seven of nine global indexes were positive year-to-date; Japan’s Nikkei 225 led with a 43.7% gain and India’s BSE SENSEX was down 9.5%.
Seven of the nine major global indexes on the watchlist were positive year-to-date through June 22, 2026. Japan’s Nikkei 225 posted the largest gain at 43.7% year-to-date. Canada’s TSX rose 10.4% and the U.S. S&P 500 gained 9.2%. India’s BSE SENSEX was the weakest, down 9.5%, while Hong Kong’s Hang Seng fell 7.3%. The remaining indexes were between those outcomes.
The watchlist follows nine country indexes: the S&P 500 (United States), TSX (Canada), FTSE 100 (England), DAXK (Germany, price-only), CAC 40 (France), Nikkei 225 (Japan), Shanghai Composite (China), Hang Seng (Hong Kong) and BSE SENSEX (India). The dataset uses the DAXK, a price-only German index that excludes dividends, to keep methodology consistent across indexes that do not include dividend returns.
A summary table accompanying the analysis lists each index’s current closing level, its all-time peak, the date of that peak and the percentage gap from the record high. The table shows where each market stands relative to its historic top.
Comparative charts in the analysis use several start dates to measure performance over time. The dates include the most recent recession start of February 3, 2020; March 9, 2009, a common low for many markets; October 9, 2007, a prior S&P 500 closing high; and the turn of the century for a longer-term view. For one chart, each index was reindexed to a value of 800 on March 9, 2009 and plotted on a logarithmic vertical axis to display proportional changes. The charts include percent-change callouts showing performance from each start date to the latest weekly close.
The analysis records the dates when indexes hit their lows during the global financial crisis and recovery: the S&P 500, TSX, CAC 40 and BSE SENSEX on March 9, 2009; the Nikkei 225 on March 10, 2009; the DAXK on March 6, 2009; the FTSE 100 on March 3, 2009; the Shanghai Composite on November 4, 2008; and the Hang Seng on October 27, 2008.
The report also lists examples of exchange-traded funds that correspond to the tracked markets, including WisdomTree Japan Hedged Equity Fund (DXJ), WisdomTree Europe Hedged Equity Fund (HEDJ), KraneShares CSI China Internet ETF (KWEB), iShares MSCI India ETF (INDA), iShares MSCI Hong Kong ETF (EWH), iShares MSCI Canada ETF (EWC) and SPDR S&P 500 ETF Trust (SPY). These ETFs are presented as instruments commonly used to gain exposure to the country-specific market returns described.
Tags
Articles by this author