10-year Treasury yield weekly average 4.44% in June
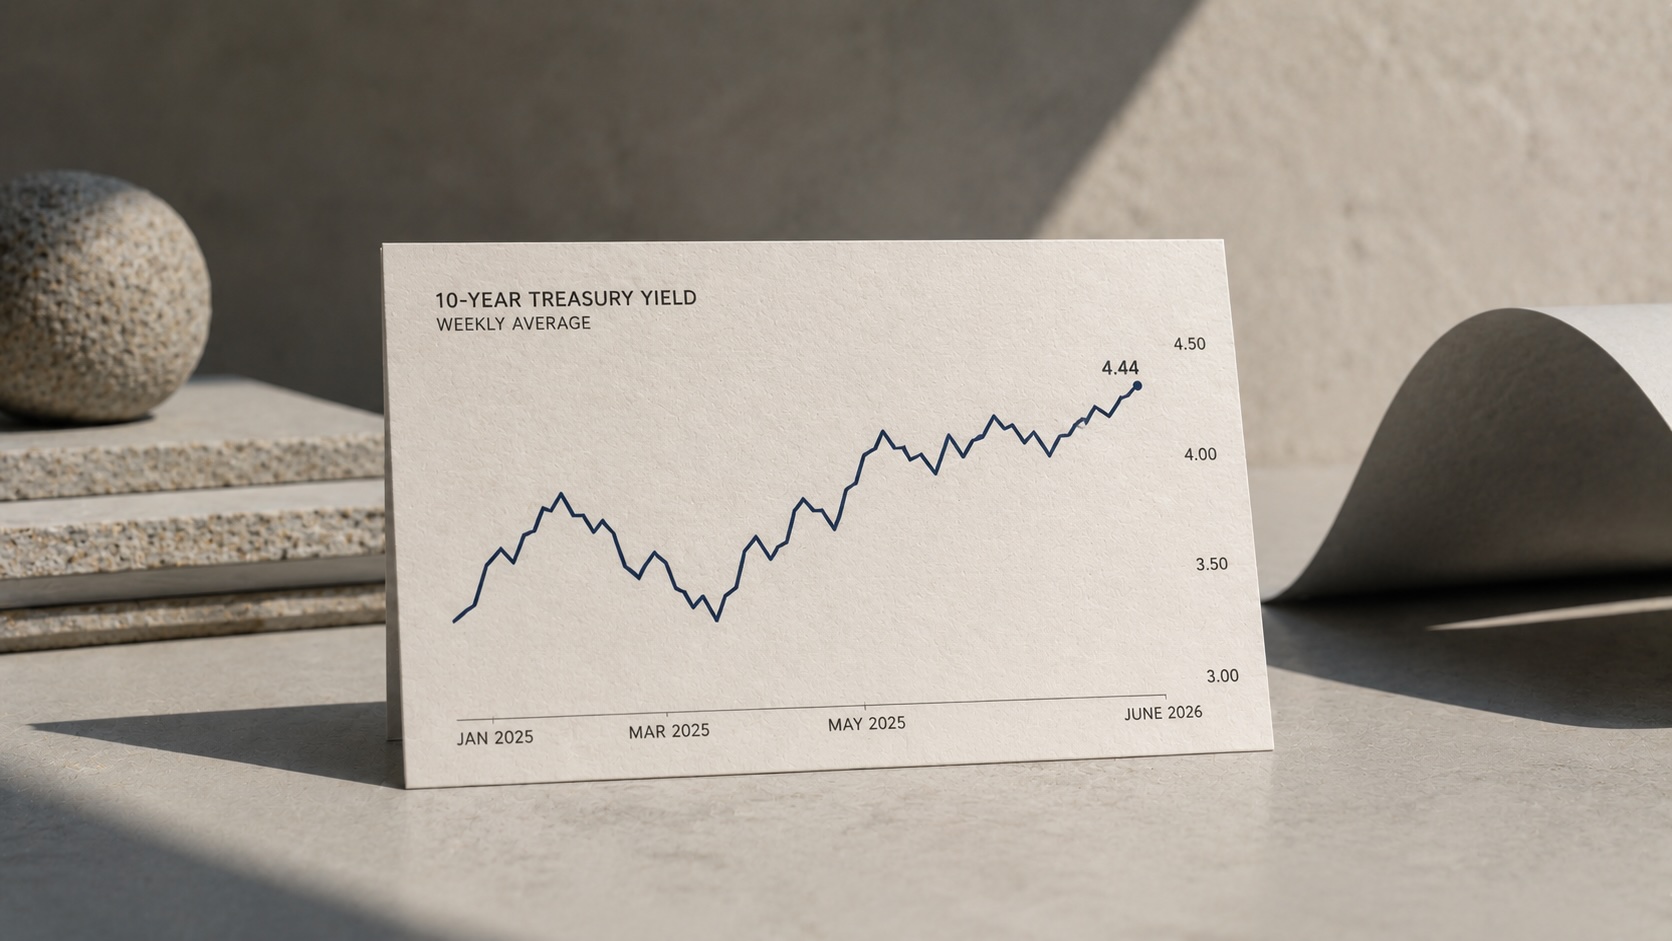
The 10-year Treasury’s weekly average was 4.44% at the end of June 2026, falling alongside recent Federal Reserve rate cuts while inflation stood at 4.25%.
The 10-year Treasury yield’s weekly average was 4.44% at the end of June 2026. The yield has trended lower in the first half of 2026 as the Federal Reserve cut its policy rate, while inflation remained at 4.25%.
From the mid-1960s through the early 1980s, U.S. interest rates moved through large cycles. The federal funds rate reached 20.06% in January 1981. The 10-year Treasury’s weekly average peaked at 15.68% in October 1981. In contrast, the federal funds rate fell to about 0.04% in May 2020 and the 10-year hit a weekly average low of 0.55% in August 2020.
Inflation rose sharply in 2021–2022 and the Federal Reserve raised its policy rate rapidly from May 2022 through August 2023. The 10-year yield rose alongside those policy increases. The Fed held policy steady for just over a year as inflation cooled, then cut rates three times beginning in September 2024. The central bank kept rates steady in the first half of 2025 and then implemented three further cuts late in 2025. Over the first half of 2026 the 10-year moved lower and reached the 4.44% weekly average at the end of June.
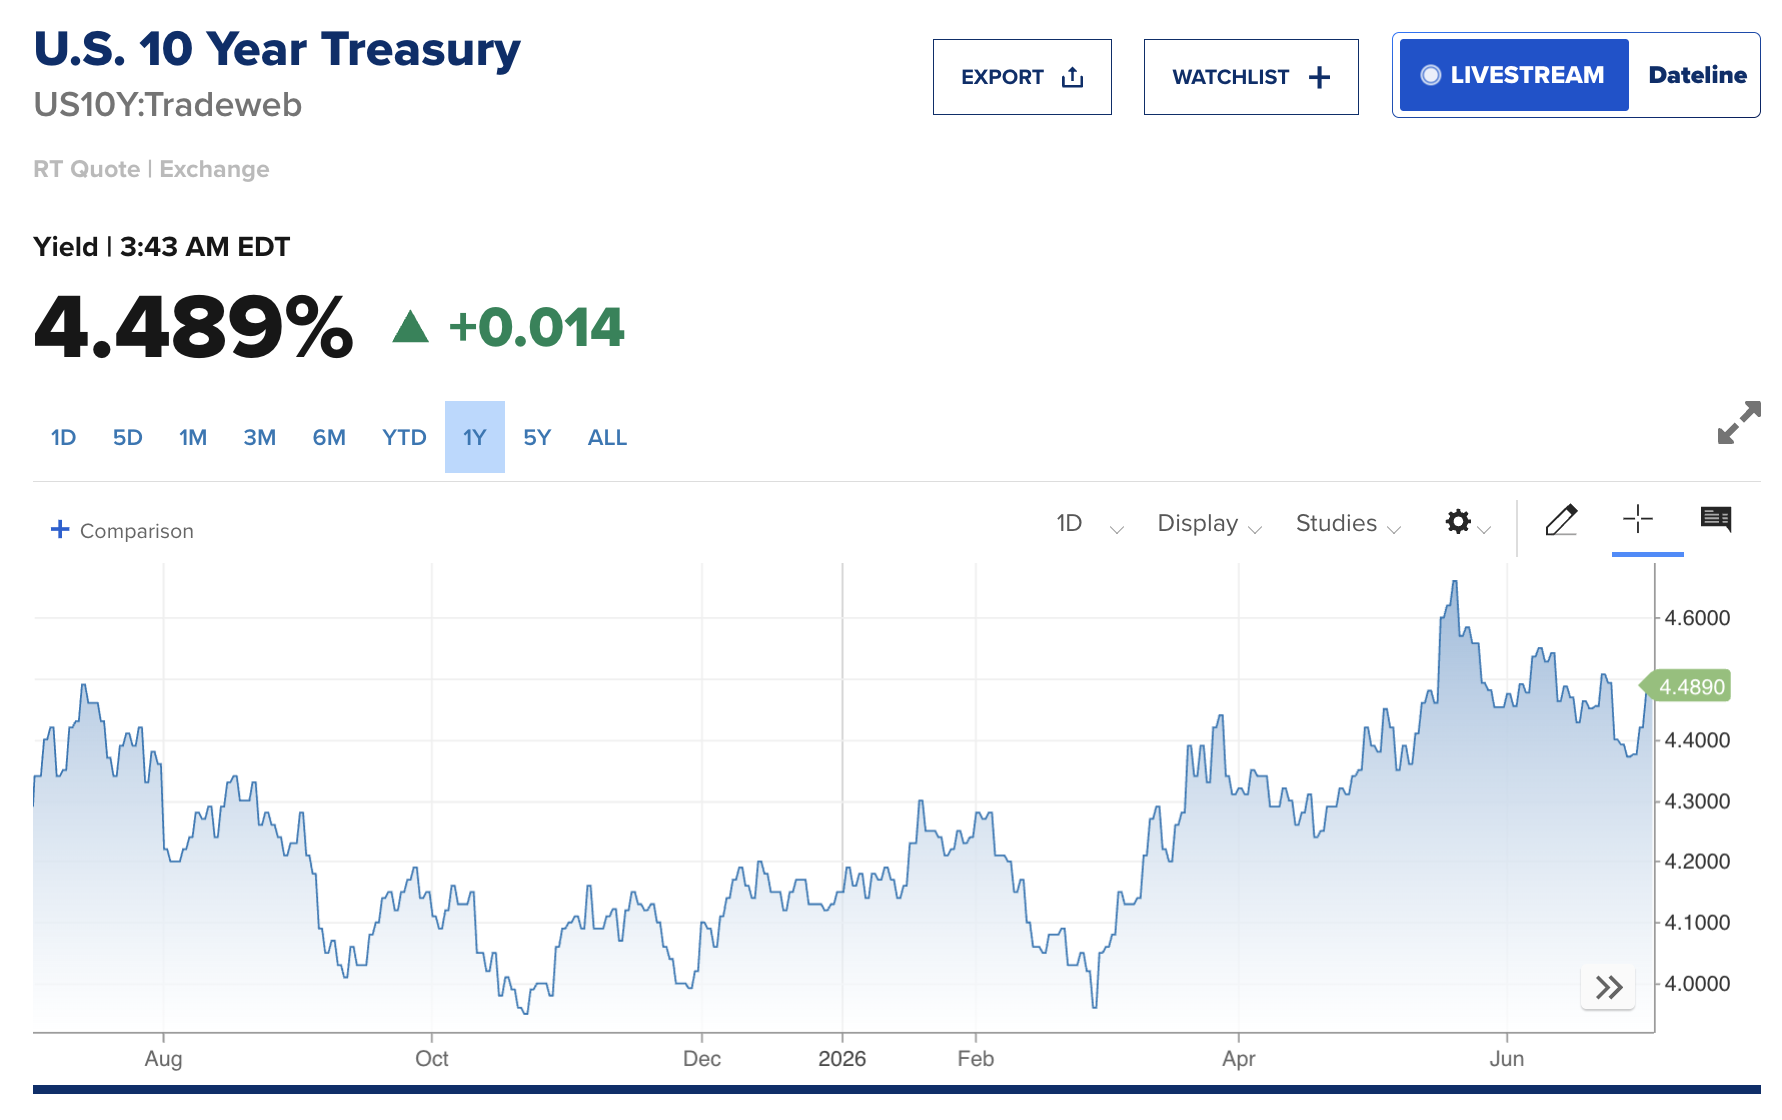
At its latest meeting the Federal Open Market Committee left the federal funds rate target at 3.50%–3.75%. The committee noted, “Inflation remains elevated relative to the Committee’s 2 percent goal, in part reflecting supply shocks that have driven price increases in certain sectors, including energy.” The statement also said the Fed will “deliver price stability.” Market probabilities on the CME FedWatch Tool placed roughly a 73% chance of no change at the next meeting and a roughly 27% chance of a 25 basis point hike.
The relationship between Treasury yields and equities has varied over time. In many periods stocks and long-term yields moved in opposite directions, but during recent high-inflation episodes both have risen together as higher rates and inflation affected corporate profits and bond pricing. Charts that adjust the S&P 500 and 10-year yields for inflation using the Consumer Price Index show a large decline in real equity returns from the mid-1960s through 1982.
The historical record contains episodes of very high and very low policy rates that produced large moves in the 10-year yield. In the current cycle the 10-year has declined in step with recent Fed cuts while inflation remains above the Fed’s 2% objective, leaving policy settings and market expectations under continued review.
Articles by this author